用几行Python和消费数据做客户细分
A small educative project for learning “Customer Segmentation” with a simple Data Analysis technique
Originally from Media
细分客户群是向客户提供个性化体验的关键。它可以提供关于客户行为、 习惯与偏好的相关信息,帮助企业提供量身定制的营销活动从而改善客户体验。 在业界人们往往把他吹嘘成提高收入的万能药,但实际上这个操作并不复杂, 本文就将带你用简单的代码实现这一项目。
Why should you care about customer segmentation? To deliver personalized experiences to customers, segmentation is key. It can provide insights into your customers behavior, habits, and preferences, allowing you to offer tailored marketing campaigns increasing your odds of success as well as improving your customers experience with tailored content.
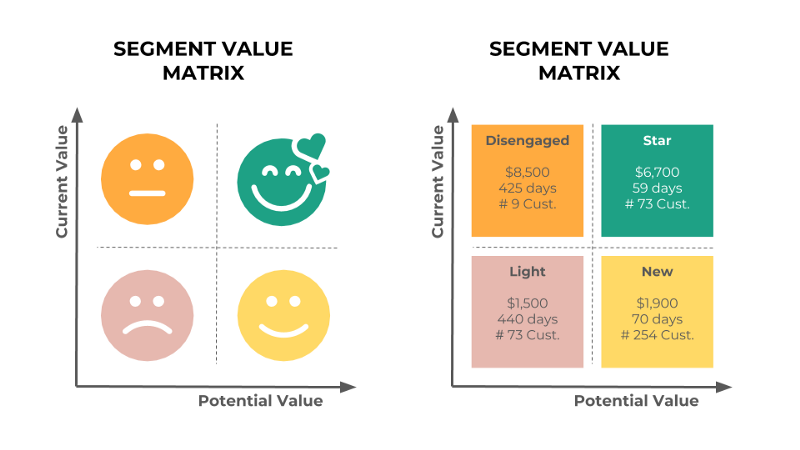
What are we going to build? Using transactional purchasing data, we will be able to create a 2 x 2 value matrix to create 4 customers groups. Each group will defer f rom the other depending on 2 dimensions: (1) current customer value, and (2) potential customer value.
What technique are we going to use? We are going to use the RFM model to create the required features from transactional purchasing data. The RFM model stands for:
- Recency: When was the last time they purchased?
- Frequency: How often and for how long have they purchased?
- Monetary Value/Sales: How much have they purchased?
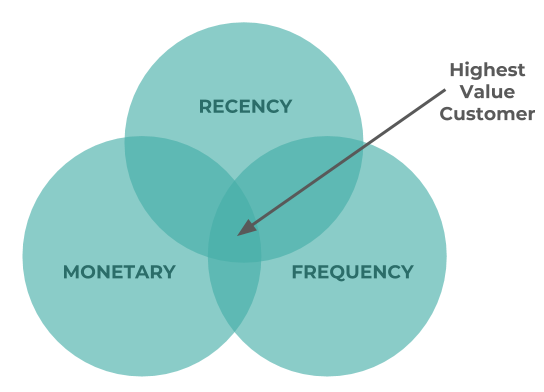
It’s usually used to identify the Highest Value Customer at the intersection of each 3 questions. To build the 2 x 2 matrix we will only use the R & the M from RFM.
What data are we using? We are going to use the purchased sample data set provided by Tableau also known as “Global Superstore”. It is often used for forecasting and time series analysis. It contains more than 1500 different customers and 4 years of purchase data. Since we are doing a behavioral segmentation and not a demographic segmentation, we will remove some potential demographic bias by filtering only on the B2C segment (consumer) and the USA country.
Approaches are:
- Step 0: Load, filter, clean, and aggregate the data at the customer level
import matplotlib as plt
import numpy as np
%matplotlib inline
import warnings
warnings.filterwarnings('ignore')
import pandas as pd
url = 'https://github.com/tristanga/Data-Analysis/raw/master/Global%20Superstore.xls'
df = pd.read_excel(url)
df = df[(df.Segment == 'Consumer') & (df.Country == 'United States')]
df.head()
- Step 1: Create RFM Features for each customers
df_RFM = df.groupby('Customer ID').agg({'Order Date': lambda y: (df['Order Date'].max().date() - y.max().date()).days,
                                        'Order ID': lambda y: len(y.unique()),
                                        'Sales': lambda y: round(y.sum(),2)})
df_RFM.columns = ['Recency', 'Frequency', 'Monetary']
df_RFM = df_RFM.sort_values('Monetary', ascending=False)
df_RFM.head()
- Step 2: To automate the segmentation we will use 80% quantile for Recency and Monetary
# We will use the 80% quantile for each feature
quantiles = df_RFM.quantile(q=[0.8])
print(quantiles)
df_RFM['R']=np.where(df_RFM['Recency']<=int(quantiles.Recency.values), 2, 1)
df_RFM['F']=np.where(df_RFM['Frequency']>=int(quantiles.Frequency.values), 2, 1)
df_RFM['M']=np.where(df_RFM['Monetary']>=int(quantiles.Monetary.values), 2, 1)
df_RFM.head()
- Step 3: Calculate RFM score and sort customers
# To do the 2 x 2 matrix we will only use Recency & Monetary
df_RFM['RMScore'] = df_RFM.M.map(str)+df_RFM.R.map(str)
df_RFM = df_RFM.reset_index()
df_RFM_SUM = df_RFM.groupby('RMScore').agg({'Customer ID': lambda y: len(y.unique()),
                                        'Frequency': lambda y: round(y.mean(),0),
                                        'Recency': lambda y: round(y.mean(),0),
                                        'R': lambda y: round(y.mean(),0),
                                        'M': lambda y: round(y.mean(),0),
                                        'Monetary': lambda y: round(y.mean(),0)})
df_RFM_SUM = df_RFM_SUM.sort_values('RMScore', ascending=False)
df_RFM_SUM.head()
- Step 4: Visualize the Value Matrix and explore some key numbers
# 1) Average Monetary Matrix
df_RFM_M = df_RFM_SUM.pivot(index='M', columns='R', values='Monetary')
df_RFM_M= df_RFM_M.reset_index().sort_values(['M'], ascending = False).set_index(['M'])
df_RFM_M

# 2) Number of Customer Matrix
df_RFM_C = df_RFM_SUM.pivot(index='M', columns='R', values='Customer ID')
df_RFM_C= df_RFM_C.reset_index().sort_values(['M'], ascending = False).set_index(['M'])
df_RFM_C

# 3) Recency Matrix
Some takeaways / quick wins with very simple sales & marketing tactics examples?
-
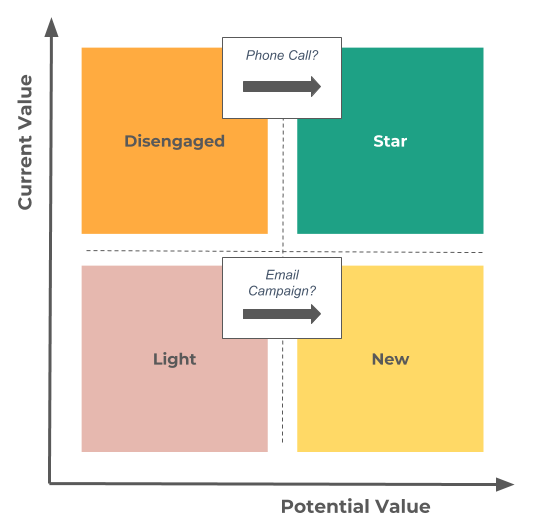
There are few customers in the “Disengaged” bucket and they have an average revenue higher than the “Star” bucket. Since there are very few of them, it should be easy to partner with the business to understand what happened at the customer level. Based on the analysis, there might be a simple quick win: reactivate few of them with a phone call or meeting to hopefully move them back to the “Star” bucket (e.g. engaged customers).
-
The average last order from the “Light” bucket is very old (more than 1 year vs. 60-70 days for ‘engaged’ customers). Launching a simple reactivation campaign with a coupon might be an initiative that could lead to some new orders and help some of these customers move to the “New” bucket (e.g. engaged customers).
The notebook is available on Github. Thank you for reading my post if you enjoyed it, please clap. Feel free to contact the author if you want to make simple or more complex RFM segmentations within your organization.
Other interesting read to learn more about RFM with k-means for Python:
k-means Clustering for Customer Segmentation: A Practical Example